Link to Github Repository

Fires in NYC

Final Project by Kevin Fernandez

Background and Hypothesis

Its important to know that the community you and your loved ones are living in are safe when it comes to the unexpected. Throughout the year, NYC has experienced fires across all 5 boroughs. These fires destroy belongings, homes and even take lives. I think its important to know whether certain areas of NYC are more prone to these fires which is what I have been researching this semester. Before I began to research for this project, I believed that fires occured more in old and disadvantaged areas compared to areas that possess newer buildings and resources. By "disadvantaged", I mean areas that contain old infrastructure and these infrastructures usually possess old machinery like stoves, boilers, etc. I hypothesize that low-income areas are more likely to have fire incidents compared to high-income areas. My data table contains over 100,000 incidents and I must show certain data to prove my hypothesis. In this project, I used the pandas and matplotlib libraries to filter and show data.

Queens Fire Data

I will first start off with Queens. Queens does contain multiple areas that are considered "low-income areas" and "high-income areas" but for this project I will only be fosusing on one of each for each borough. As an example of a low-income area, I chose Jamaica, Queens and an example of an high-income area, I chose Rego Park/Forest Hills Queens. Each row is every incident that has occured from the beginning of the year 2021 to May 5th 2021. Every row is counted as one incident. I had to look up these area's and their community district numbers to get an accurate amount of incidents for each area. Jamaica's community district number is 412 and the community district number for Rego Park/ Forest Hills is 406. Jamaica has had 5,210 incidents in those 5 months and Rego Park/Forest Hills has had a low 1,519 number of incidents. As you can see, Jamaica has about 4x more incidents than Rego Park/ Forest Hills does which supports my idea of low-income areas being more prone to these fire incidents.

Brooklyn Fire Data

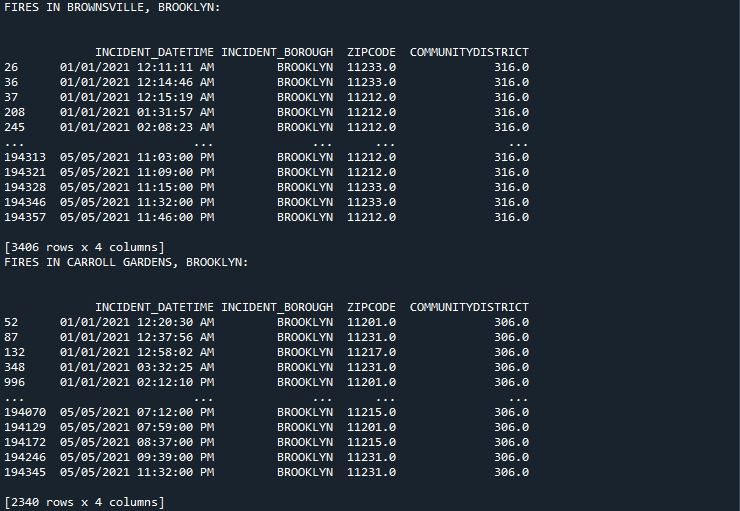
Similar to Queens, Brooklyn also contains areas within the borough that are considered either low-income or high-income areas. An example of a low-income area I used is the area of Brownsville, Brooklyn. As for high-income, I chose the city of Carroll Gardens, Brooklyn. Brownsville's community district code is 316, according to the data table, and the district code for Carroll Gardens is 306. After filtering each city by their own community district within the table, Brownsville contained 3,406 fire related incidents while Carroll Gardens contained 2,340 fire related incidents in the first 5 months of 2021. Brownsville has over 1,000 more incidents compared to Carroll Gardens.

Bronx Fire Data

This is where the data becomes interesting. For the Bronx, for a low-income example, I chose Hunts Point, Bronx and for the high-income area example, I chose the areas of Riverdale/Fieldson, Bronx. Hunts Point's community district code is 202, according to the data table, and the Riverdale/Fieldson's community district code is 208. I discovered that these two districts were not far apart when it came to incidents. Hunts Point had 2,136 fire incidents while the district of Riverdale/Fieldson had a rather close amount of 2021 fire related incidents. Hunts Point beats Riverdale/Fieldson with a little over 100 incidents.

Manhattan Fire Data

When it comes to the borough of Manhattan, most areas are considered to be high-income but this isn't true. An example of a low-income area in this borough is East Harlem, Manhattan and for high-income, The Upper East Side is a good example to use. East Harlem's community district code, according to the data table, is 111 and the Upper East Side's community district code is 108. East Harlem had 5,613 fire incidents while the Upper East Side has had a total of 3,243 incidents in the first 5 months of 2021. East Harlem has an alarming lead possessing more than 2,000 incidents than the Upper East Side.

Staten Island Fire Data

In general, Staten Island only has 3 districts but I was able to compare them. For low-income area, I chose St.George/Stapleton as an example and an example of a high-income area is Tottenville/ Great Kills, Staten Island. St. George/ Stapleton's community district code is 501 and the community district code for Tottenville/Great Kills is 503. The total amount of fire related incidents in the St. George/ Stapleton area is 4,060 incidents while the total amount of incidents in the Tottenville/Great Kills area is 2,284. St. George/Stapleton area possesses over 1,500 incidents than Tottenville/Great Kills.

Fire Data Throughout all Boroughs

Techniques Used

I imported the pandas and the matplotlib libraries to gather my data. I used matplotlib for my graph and pandas to remove, filter and sort the columns and rows of my data table. To remove unecessary columns that had nothing to do with my project, I used the drop command which drops stated columns from the csv file. There was A LOT of unecessary info so I used the command alot to make my data neater and presentable. After I dropped these columns, it was time to filter the data by borough and community district number. I used the dataframe.loc command which allowed me to find certain values in a column that contained a specific value, for example, "QUEENS", and it would find all the rows in the borough column that contains "QUEENS". I did this for all 5 boroughs and I also filtered them all based on community district codes depending on which area of a borough I was using. Now that I filtered the areas of each borough, I needed to put all this information on a presentable graph and this is where matplotlib comes to play. I created a dataframe within my code that contained all the values of the low-income and high-income incidents throughout the 5 boroughs.I used plotdata.plot to describe what kind of graph I want and the size. I gave the graph a title and labels using commands such as plt.title and plt.xlabel.